Spectral Flow Cytometry Capabilities

Full spectrum technology has taken flow cytometry to the next level of performance and flexibility delivering deep immunophenotyping capabilities with outstanding resolution.
  • Spectral unmixing for deeper immunoprofiling

  • Intuitive panel design for customizing panels

  • Autofluorescence extraction for improved sensitivity and resolution

How does spectral flow cytometry work?

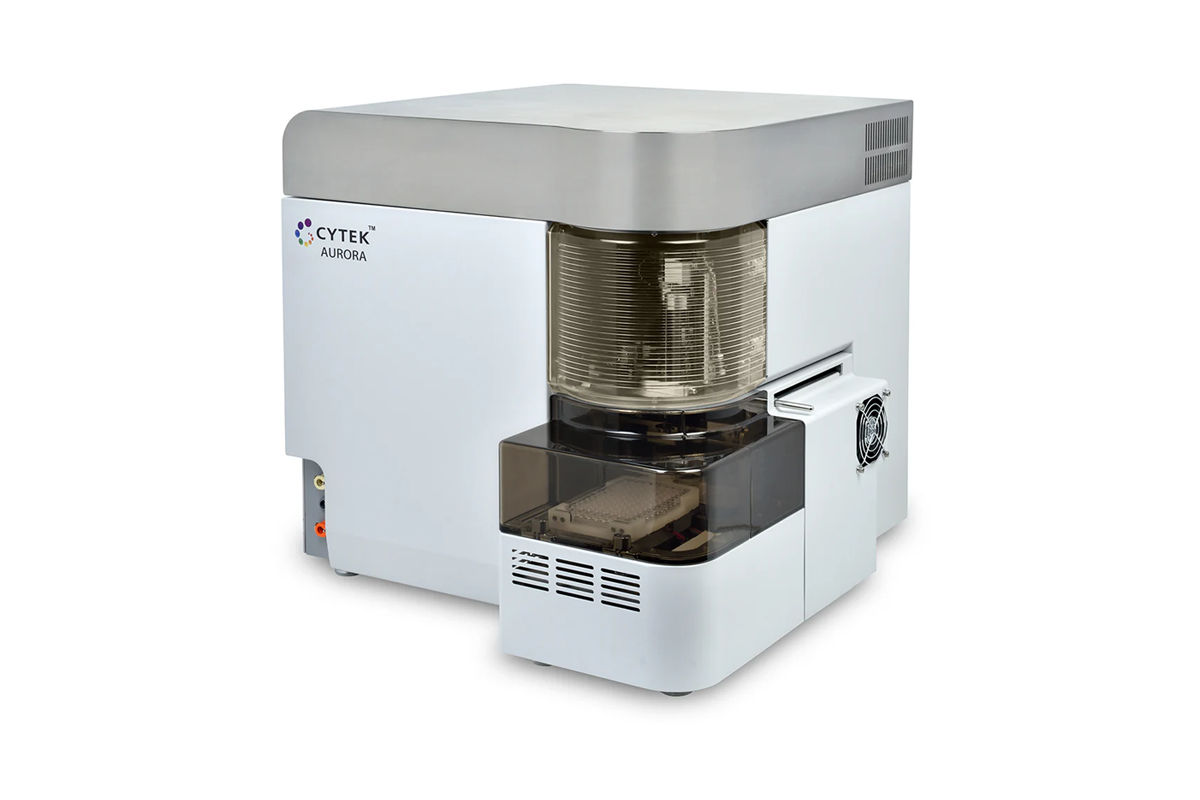
Spectral flow cytometry offers unique optical collection and analytical capabilities enabling the use of a wide range of fluorochrome combinations without reconfiguring the system for each application, resulting in exceptional sensitivity with simple and intuitive operations. Full spectrum signatures are generated for each fluorochrome bound to cellular markers that are used to identify different cell types. Different signatures present in a multicolor sample are then unmixed to allow the use of fluorochromes with close emission peaks in the same sample. This expansion in fluorochrome options and panel size potential, along with the vacuum-powered fluidics system, makes the Cytek® Aurora spectral flow cytometry particularly suitable for studies where unique biomarker signatures are sought or sample availability is limited.

In a conventional flow cytometer, pacific blue and brilliant violet 421 (BV421) cannot be used together as the spectral signatures are too similar.


In a conventional flow cytometer, pacific blue and brilliant violet 421 (BV421) cannot be used together as the spectral signatures are too similar. In spectral flow cytometry, pacific blue and BV421 have enough distinctions (a complexity index of 0.78) in their spectral signatures to be used in combination.

Advantages of spectral flow cytometry
 

More detection

5 lasers with 64 fluorescence detectors

Greater Flexibility

Use of a wide array of new fluorochrome combinations without the need to reconfigure optical filters

Outstanding Sensitivity

  • Unmixing of fluorochrome with close emission peaks
  • Use of autofluorescence extraction to improve data clarity

More colors

Detection of up to 40 different cell types/targets in the same multicolor sample

High Value System

Larger datasets generated from smaller sample sizes

Advanced technology with full analytical compatibility and familiar workflows

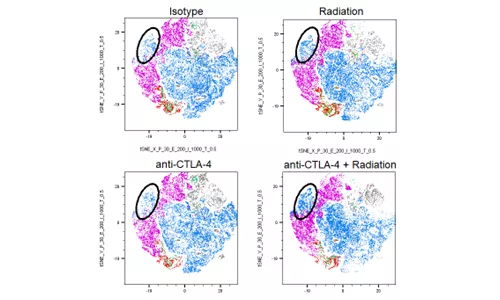
Spectral flow cytometry offers several advantages over conventional flow cytometry and at the same time is amenable to complex analyses of multiparameter flow cytometric data such as the t-Distributed Stochastic Neighbor Embedding (tSNE) analysis that allows for an unbiased analysis of all markers in the panel to help discern phenotypic changes within cell subsets that would otherwise go undiscovered. Spectral flow cytometry has all the capabilities of conventional flow cytometry, follows the same workflow and shares the same requirements, while expanding its functionalities.

4T1-Luc2-1A4 tSNE analysis Plotting traditional gating populations over the tSNE map allows the visualization of shifts in the expression of any panel markers (population shifts) between treatment groups

    Advanced technology with full analytical compatibility and familiar workflows

    Big insights from small samples

    Our expert flow cytometry team can perform deep immunophenotyping investigation of your in vivo study to capture shifts that occur in the immune response triggered by test agent treatment. Below is a list of our standard spectral panels. These panels have the capacity for additional markers to be added and completely custom panels can be developed for your assay needs.

    Provides immunophenotypic analysis of 19 distinct myeloid subsets

    Antibody/Dye

    Description

    CD45

    Pan-hematopoietic cell marker

    CD45 (mouse)

    Mouse immune cell exclusion

    CD3

    Pan-T cell marker

    CD4

    CD4+ T cell marker

    CD8

    CD8+ T cell marker

    FoxP3

    Regulatory T cell marker

    CD56

    Natural killer/Natural killer T cell marker

    CD16

    Differentiation marker

    CD19

    B cell marker

    CD20

    B cell marker

    CD11b

    Pan-myeloid lineage marker

    CD68

    Macrophage marker

    HLA-DR

    M1 macrophage marker

    CD163

    M2 macrophage marker

    CD14

    Monocyte marker

    CD33

    Myeloid delineation

    CD84

    MDSC marker

    CD11c

    Dendritic cell marker

    BDCA3 (CD141)

    DC1 subset marker

    BDCA1 (CD1c)

    DC2 subset marker

    CCD123

    pDC marker/Basophil marker

    CD66b

    Neutrophil marker

    CD15

    Neutrophil marker

    CD86

    Maturation marker

    Viability Dye

    Dead cell exclusion

    Provides absolute counts, quantitation of 13 lymphoid and myeloid subsets, memory T cell measurements and analysis of 12 functional markers to profile T cell, dendritic cell, macrophage and MDSC phenotypes

    Panel 1: Antibody/Dye

    Description

    CD45

    Pan-hematopoietic cell marker

    CD3

    Pan-T cell marker

    CD4

    CD4+ T cell marker

    CD8

    CD8+ T cell marker

    FoxP3

    Regulatory T cell marker

    CD25

    Regulatory T cell marker

    CD44

    Activation/Memory marker

    CD62L

    Naïve T cell/Memory marker

    PD-1

    Activation/Exhaustion marker

    CD69

    Activation marker

    LAG-3

    Activation/Exhaustion marker

    TIM-3

    Exhaustion marker

    ICOS

    Activation marker

    Granzyme B

    Cytotoxicity marker

    CKi-67

    Proliferation marker

    CD49b/CD335

    Natural killer/Natural killer T cell marker

    CD19

    B cell marker

    CD11b

    Pan-myeloid lineage marker

    Ly-6G

    Granulocytic-MDSC/ Neutrophil marker

    Ly-6C

    Monocytic-MDSC/Monocyte marker

    CD11c

    Dendritic cell marker

    CD24

    Dendritic cell delineation

    F4/80

    Pan-macrophage marker

    MHC Class II

    M1 macrophage & dendritic cell marker

    CD206

    M2 macrophage marker

    CD103

    DC1 subset marker

    XCR1

    Cross presenting/Migratory dendritic cell marker

    CD80

    Maturation marker 

    CD86

    Maturation marker

    MARG1

    Myeloid functional marker

    iNOS

    Myeloid functional marker

    PD-L1

    Immunosuppression

    Viability Dye

    Dead cell exclusion


    Panel 2: Antibody/Dye

    Description

    Counting Fluorosphere Beads

    Cell enumeration reagent

    CD45

    Pan-hematopoietic cell marker

    Viability Dye

    Dead cell exclusion

    Provides deep phenotypic analysis into T cell, NK and B cell subsets, combining 11 activation and exhaustion markers. Included is the delineation of naïve stem cell memory, central memory, effector memory, terminal effector and tissue resident memory (Trm) subsets.

    Antibody/Dye

    Description

    CD45

    Pan-hematopoietic cell marker

    CD3

    Pan-T cell marker

    CD4

    CD4+ T cell marker

    CD8

    CD8+ T cell marker

    TCRgd

    Gamma Delta T cell marker

    FoxP3

    Regulatory T cell marker

    CD25

    Activation/regulatory T cell marker

    CD69

    Activation marker

    LAG3

    Activation/Exhaustion marker

    CD27

    Activation marker

    ICOS

    Activation marker

    TIM3

    Exhaustion marker

    PD-1

    Activation/Exhaustion marker

    TIGIT

    Exhaustion marker

    TCF7

    Exhaustion marker

    Granzyme B

    Cytotoxicity marker

    CXCR5

    T cell recruitment

    CXCR3

    T cell recruitment

    CD56

    Natural killer/Natural killer T cell marker

    CD16

    Natural killer/Natural killer T cell marker

    CD19

    B cell marker

    CD20

    B cell marker

    Ki-67

    Proliferation marker

    CD45RA

    Memory T cell delineation

    CD45RO

    Memory T cell delineation

    CCR7

    Memory T cell delineation

    CD62L

    Memory T cell delineation

    CD95

    Memory T cell delineation

    CD103

    Memory T cell delineation

    Viability Dye

    Dead cell exclusion

    Spectral flow cytometry capabilities FAQs

    Spectral flow cytometry presents unique advantages over conventional flow cytometry in the following scenarios:

    • When sample availability is limited
    • When deep immunoprofiling is needed to analyze up to 40 targets
    • When analyzing sample types with high autofluorescence such as lung tissue
    • When unique biomarker signatures are sought
    • When particles as small as 100 nm need to be analyzed

    We have spectral immunophenotyping panels for both human and mouse samples:

    • Spectral Human CompLeukocyte™ panel
    • Spectral Human CompLymphocyte™ panel
    • Spectral Expanded CompLeukocyte™ (murine) package
    • Cytek® validated panels can also be used as provided here cytekbio.com/collections/kits

    Dyes emitting in the 365-829 nm range can be captured efficiently with the highly sensitive Coarse Wavelength Division Multiplexing semiconductor arrays.