The data analysis software in GeoMx DSP supports easy visualization and interpretation of data. High-resolution images can be displayed alongside quantitative profiling data, allowing interaction with either dataset in real time.
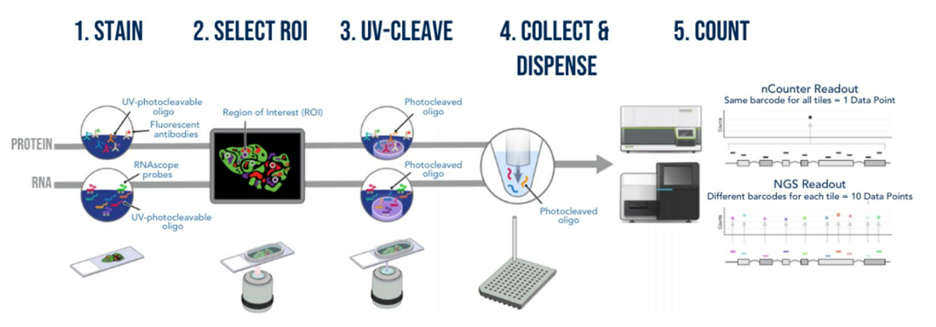
How does GeoMx DSP work?
The assay relies on RNA probes coupled with photocleavable oligonucleotide tags. After hybridization of probes to slide-mounted formalin-fixed paraffin-embedded (FFPE) tissue sections, the oligonucleotide tags are released from discrete, chosen regions of the tissue via UV exposure. Released tags are quantitated using RNAseq or a standard nCounter assay, and counts are mapped back to tissue location, yielding a spatially resolved digital profile of analyte abundance.1


